Create a free profile to get unlimited access to exclusive videos, sweepstakes, and more!
The Sun's motion, reflected in the galaxy

Yesterday, the European Space Agency did an astonishing thing: They released data from the Gaia mission, a space telescope that is mapping the positions, velocities, and colors of stars in the sky.
Doesn’t sound like a big deal to you? Oh wait, I forgot to mention: They’ve got this data for 1.7 billion stars.
Yes, billion. With a B. Yegads.
Astronomers across the planet are jumping on this archive like matter being pulled into a black hole. The amount of data in it is vast, and incredibly useful. It will be used to determine the compositions and ages of star clusters, help us distinguish similar-looking but critically different kinds of stars, get more details on how stars live and die, find stars on odd orbits around the galaxy, build better maps of the shape, size, and structure of our own Milky Way Galaxy, and backtrack stars’ position millions of years ago and predict those positions millions of years into the future. It’ll tell us about exploding stars, forming stars, and even things closer to home like asteroids in the solar system (there are 14,000 such objects in this new release, which will also help us nail down their orbits better). And, of course, as a compendium of accurate star positions it will be useful to guide telescopes for decades to come. Papers have already been published making use of this treasure trove.
The best part is that this database will be used for ideas we don’t have yet. What will someone come up with a few years down the road, where simply having such a huge collection of data will make or break a new hypothesis or even an old one that we thought was right?
I could go on and on, but there is one thing I saw that really struck me, a map that came along with all the press releases about this. It will look odd to you at first, but it shows something that’s just really cool*.
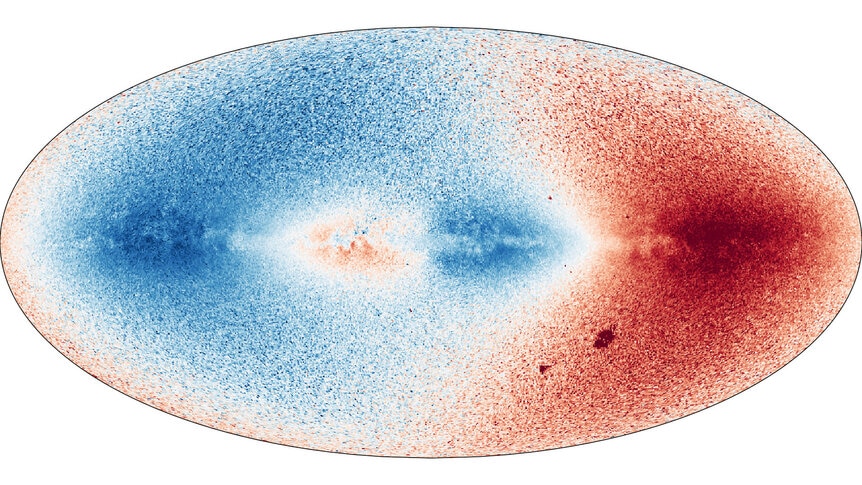
This is a velocity map, showing how fast stars in the sky are moving toward us (shown in blue) or away (shown in red). Each blip mapped is a section of the sky with stars in it, and the deeper the color the higher the average velocities of the stars in it. The map was made using a spectrometer, which breaks up starlight into individual colors, and then uses the Doppler shift in that light to determine speeds.
Mind you, these are what we call radial velocities, literally toward or away from us. There’s also tangential velocity (motion across the sky), which is harder to measure. Together, these two velocities combine to make the star’s true motion in space. But even with just the radial velocity, there’s a lot we can see.
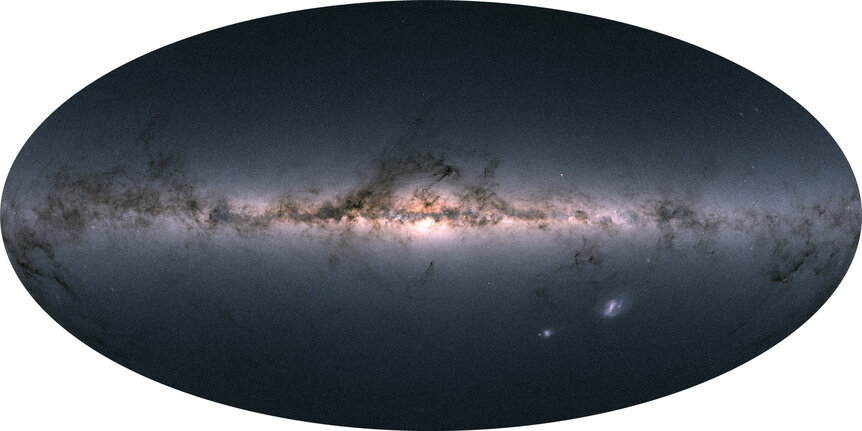
First, take another look at the first image above, the one showing the sky. The entire sky is shown, but the map is an ellipse. This is called a Molleweide projection, and it’s a pretty standard way to map what’s essentially the surface of a sphere in two dimensions. You’ve probably seen the Earth mapped this way many times.
In this case the sky is mapped in galactic coordinates. The Milky Way is a vast flat disk 100,000 light-years across, and the Sun is about 26,000 light-years from the center, so roughly halfway out in the disk. In that map the center of the galaxy (which we see toward the constellation of Sagittarius) is the center of the map. Going left or right looks along the disk, looking up (toward galactic north) or down (galactic south) takes your view up and out of the disk.
The same with the velocity map. The center is the galactic center, and the line across the middle is the midplane of the disk. But here’s where things get fun: The Sun is moving around the galactic center, and so is every star in the sky. But they’re moving at different velocities! More or less, stars closer in to the center of the galaxy (that is, less than 26,000 light-years from the core) move faster than we do, and stars farther out move more slowly. It’s actually quite a bit more complicated than that, but this simplification will do.
In this map, the Sun is moving toward the left side of the galaxy. So stars outside our galactic radius are moving in the same direction we are, but more slowly. So they are blue-shifted, moving toward us. Or, perhaps easier to picture, we’re moving toward them, catching up to them. It’s just like two cars moving down a highway at different speeds, and one passes another. From inside the faster car it looks like the slower one is moving backward, toward you, until you pass it.
Now let your gaze move to the right a bit, so you’re halfway out from the center. The blue fades to white. That’s because stars there are at the same distance as the Sun from the galactic center. They are moving at roughly the same velocity as the Sun, so they are neither blue- nor red-shifted! Then, a little bit more to the right, the white turns red. Those are stars moving in the same direction we are, but are closer to the galactic center, so they’re moving more rapidly. They’re pulling ahead of us, away, so they are red-shifted.
Then you reach the center. The Sun orbits the galaxy in pretty much a circle, so it never gets closer or farther from the center. So why isn’t the center white?
That’s because Gaia can’t see the center! There’s so much gas and dust between us and the galactic core that we can’t see it in visible light. I suspect it looks blue there in the map because we’re looking at the nearest spiral arm toward the center (the Scutum-Centaurus arm), and its overall motion is toward us.
Now, if you keep moving to the right in the diagram, things switch. You see stars inside our orbit and moving faster than us, so toward us, and they are mapped as blue. Then you get to our galactic radius, which is white again, then stars outside our orbit moving more slowly than we are, so we’re pulling away, and they look red-shifted.
Incidentally, the two red patches in the south on the right are the Large and Small Magellanic Clouds, two dwarf satellite galaxies of the Milky Way. As you can see, they are moving away from us in their orbits, too. Most of the bright spots are globular clusters (like Omega Centauri just above and to the right of galactic center).
So I love this: We can see the Sun’s motion around the galactic center, in fact all the stars’ motions, and this shows us we live in a disk! That’s a remarkable thing to do just by mapping all these stars and their radial velocities. We are inside our galaxy and cannot see it from the outside, but we can still get an excellent idea of how it’s put together.
I want to make one more point. Gaia is incredibly ambitious, getting all this information for nearly 2 billion stars. And yet… that’s fewer than 1% of all the stars in our galaxy!
When you look up in the sky, at best you can see 10,000 stars, and likely far fewer. Gaia sees hundreds of thousands of times that many, yet we are just scratching the surface of the delights and mysteries the Milky Way is hiding. It’s like coming across a tree while you’re out for a walk, examining it and being in awe of it… and when you look around it, you realize you’re standing at the edge of huge forest stretching to the horizon.
Galaxies are immense. Let’s see what ours has to show us.
*I’ve written about a similar map before, made using observations of hydrogen gas. I didn’t go into as much detail that time, so this new map gives me a chance to talk about it more.