Create a free profile to get unlimited access to exclusive videos, sweepstakes, and more!
How a Canadian River Fueled a Climate Change Denial Meme
Arctic sea ice is like the fabled canary in a coal mine when it comes to global warming. The far north is very sensitive to changes in climate, with temperatures that fluctuate more than the southerly latitudes.
The extent of (that is, area covered by) Arctic sea ice has been declining of late, as has its volume (which includes the thickness). This is true no matter what time of year you look; compare the maximum extent it reaches in winter today with what it was, say, 20 years ago and you can see it’s smaller. The same is true for the minimum extent in summer. This steady melting away of ice is a clear indicator of a warming planet.
However, 2012 was an exception ... in that the amount of Arctic ice fairly well plummeted, dropping far below average. Why? Scientists think they’ve figured that out, at least partially. And not unexpectedly, when the ice shrank away, a denier claim grew.
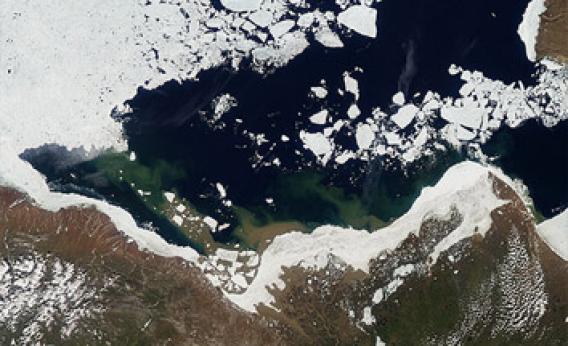
The images above are from NASA’s Aqua satellite, and they show natural-color shots of the Mackenzie River in the Canadian Arctic. Flowing north, its delta leads to the Beaufort Sea, which has copious ice floating in it in the winter. The two pictures are shown with a slider bar in between; move it back and forth to see the “before” shot (taken on June 14, 2012) and the “after” shot (taken on July 5, 2012) (Note: If you are using a mobile device you may see the images stacked vertically with no slider. If no images appear at all, click here to see them.)
In the “before” picture (moving the slider all the way to the right), you can see lots of ice in the water. Note, though, the ice piled up along the coastline. You can see the muddy water pooling in fingers stretching toward the water. That ice acted as a dam, holding the water back.
In the “after” picture (slider to the left) the dam is gone, and you can see the river water infiltrating the sea—the brown swirls are sediment washing out into the sea. Sometime in the intervening weeks the warm river water melted the ice dam and broke through, flooding the sea. This sudden infiltration of warm water raised the temperature of the sea considerably, melted the ice floating beyond.
Aqua has detectors that can see in the thermal infrared, which allows the surface temperature of the water to be taken. Here is the same region, this time showing the temperatures before and after the flood.
(Click here if you don't see the images.) The darkest blue is cold water/ice at about -2° C, and white/lavender is +15° C. As you can see, in just a few weeks the temperature went up substantially; in some places it went up about 15° Celsius, a huge increase in thermal energy; by my rough calculations it would far, far exceed the energy released by a nuclear weapon.
No wonder that ice melted.
Scientists think this is what contributed to the huge drop in Arctic ice that year. If the water were to move into the sea more slowly (as it usually does), then there would be time for its excess heat to radiate away into the atmosphere or be dropped into deeper waters. Instead, the sudden inundation due to the ice dam breaking dumped all that warmth into the sea surface, where it could melt the ice.
That’s why 2012 saw record low ice in the Arctic. The next year, things were more normal, and the ice extent and volume were more like they had been in previous years.
And this is what brought on the climate change denial fairy tale: That in 2013 the ice had “grown” by 60 percent over 2012. This is incredibly misleading; starting with a record low and then measuring from that is hardly what I’d call an honest claim. That makes it seem like global warming has stopped or even reversed, which is baloney, pure and simple. The ice extent and volume in 2013 were far below average, and while it’s early yet, 2014 is gearing up to be the same.
Incidentally, the waters in the Mackenzie (and other Canadian rivers) are warming up due to global warming as well. Coupled with thinning ice also due to warming, this water is breaking up the ice more efficiently than in previous years, which may be the overall reason ice is disappearing from the far north (incidentally, there are no rivers flowing into the Antarctic region, so the ice there is not affected in this way).
Rivers are efficient conveyors of heat, it turns out; just another piece of the huge and complicated puzzle that is global warming. Scientists studying these effects are finding more and more ways these pieces all fit together, which is a good thing. The more we understand how the planet is heating up, the better we’ll be at predicting what will happen, and how we’ll have to deal with it.
All photos by Jesse Allen and Robert Simmon, using data from the Level 1 and Atmospheres Active Distribution System (LAADS).
Correction, March 7, 2014: Due to an error in the original press release, I wrote that the temperatures were measured using microwave detectors. In actuality the maps above were generated using thermal infrared detectors on Aqua.


