Create a free profile to get unlimited access to exclusive videos, sweepstakes, and more!
The Highs and Lows of Mercury
Speaking of Mercury ...
The MESSENGER mission was a thing of wonder. It orbited Mercury for more than four years, taking copious observations of the smallest official planet in the solar system.
Its mission ended in 2015 (it had run out fuel, and could no longer correct its orbit from perturbations both by Mercury itself and the influence of the Sun), but its data live on, databased and available for analysis.
Images of the surface reveal a wealth of information, of course, but it’s more than just pretty pictures (even directly useful ones scientifically). By taking images from different viewing angles and different lighting conditions, elevation information can be determined. Taking two images and comparing them is much the same way our eyes and brains get depth information, and by combining this with different sun angles, the shadows cast give elevation information as well.
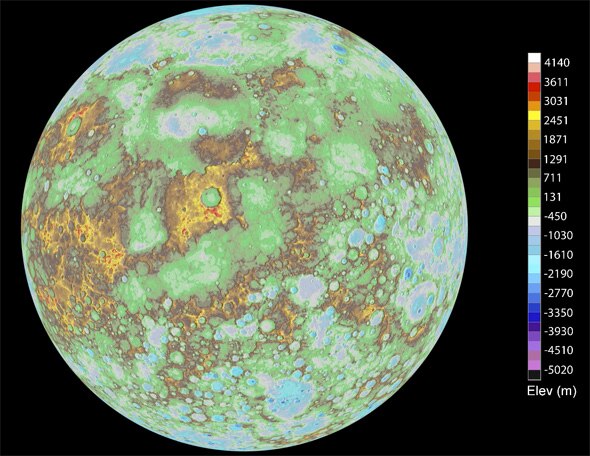
This vast amount of data—more than 100,000 images—was used to create this stunning topographical map of the entire planet’s surface:
That is very cool. And very important, too. Mercury is so close to the Sun that it’s difficult to observe from Earth (it’s the only planet Hubble has not and cannot observe, in fact). An early probe, Mariner 10, was sent there but mapped less than half the surface. MESSENGER arrived in 2011, and was the first to create maps of the full planet.
Elevation data came mostly from the Mercury Laser Altimeter. This pinged the planet with pulses of laser light, measuring how much time it took for the light to reach Mercury and bounce back to the spacecraft. If the pulse hit a hill versus a valley, it didn’t have to travel quite as far, so it would get back to the spacecraft in less time. The difference in time can be converted to a difference in distance because we know the speed of light to high accuracy. Elevation maps of the planet could be made with accuracy of under a meter.
But, due to MESSENGER’s orbit, it only mapped the northern and equatorial regions of the planet. This new map adds to that knowledge, creating a topo map of the whole thing.
That’s really important, because planets tend to have features that affect the whole body. The Moon’s Aitken Basin, for example, and Hellas Basin on Mars were from global impacts that affected the entire geological history of their respective targets. With an elevation map of Mercury, similar events can be explored.
This map reminds me of just how hard it is to define what “0” is. In this case, it’s the average over all the measurements taken, which was a monumental task. Calculating this is a problem even on Earth. We casually refer to sea level, but it’s not at all simple to define that! Sea level is different in different places (in part because the Earth’s gravity isn’t constant over its surface; plus water temperature, currents, and sea floor topography can change where the surface resides), and moreover it’s rising as polar ice melts.
Mercury doesn’t have those problems, of course. But it’s a tough planet to study, so having these maps will help. And even better: The European Space Agency and JAXA are gearing up to launch BepiColumbo next year, which will send two orbiters to the planet! When they arrive (six years later!) once again our knowledge of this tiny world will increase explosively.
Now to get my Mercury globe updated with this new info …

