Create a free profile to get unlimited access to exclusive videos, sweepstakes, and more!
Gaia's map of the sky — with two *billion* stars

An international team of astronomers called the Gaia Collaboration has released a new, updated catalog from the Gaia astronomical satellite. The catalog is staggering: It lists positions, distances, colors, brightnesses, and motions of nearly two billion stars in the Milky Way.
Two. Billion.
This is the third release of the massive catalog of observations, with many updates including more stars, and more importantly better calibration of the data. That's typical for a survey observatory that releases lots of data; as time goes on the telescope and camera are better understood and better calibration becomes available.
How big is this release? Very. It has:
- 1,811,709,771 star positions
- 1,467,744,818 star distances and sky motions
- 1,540,770,489 star colors
- 1,614,173 extragalactic sources
Gaia has been operating since January 2014 — 2323 days — and has produced a disk-busting 86,000 gigabytes of data. Yes, 86+ terabytes. And it's still going.
It seems kind of weird, just measuring these basic properties of stars. But when you do so over the entire sky, looking out deeply into the galaxy and beyond, and do so with exquisite care and accuracy, what you really end up with is a revolution in astronomy. As I've written before, it's already made a lot of fundamental and important discoveries: the distance to Polaris and to the Pleiades, solved an old riddle about the star Albireo, discovered a cluster behind the brightest star in the night sky, found the remains of an old galaxy the Milky Way ate, and then found many star streams indicating lots of old galaxies and clusters we ate.
With this new catalog all this can be refined, and new discoveries made.
For example...
This animation shows the motions of over 40,000 stars within 100 parsecs (326 light years) of the Sun, projecting them 1.6 million years into the future.
The length of the trail denotes speed; some stars are faster than others and others are closer, so they appear to move more quickly. You may notice more stars on the right side versus the left toward the end of the animation; this is due to the Sun's motion with respect to the stars. The stars chosen for this animation are the closest now, but as the Sun moves in one direction the stars appear to move in the other. At the end of the animation is a brief display showing the trails representing 400,000 years of motion.
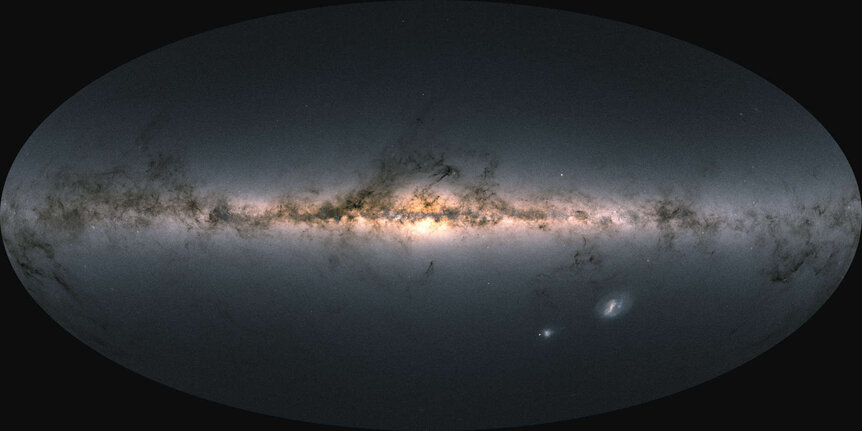
The image above is interesting: It's not really an image! It's a map of the entire sky (using an elliptical Mollweide projection) where the positions, colors, and brightnesses of the stars are plotted using the Gaia data. You can clearly see the shape of the galaxy — we live in the disk of the Milky Way, so we see it as a thick flat line in projection on the sky — huge dust clouds, and to the lower right the two Magellanic Clouds, satellite galaxies of our own.
Compare that to this image, which shows the same information but doesn't map star brightness, so instead shows the density of stars on the sky, with brighter patches showing more stars in one area versus darker patches:
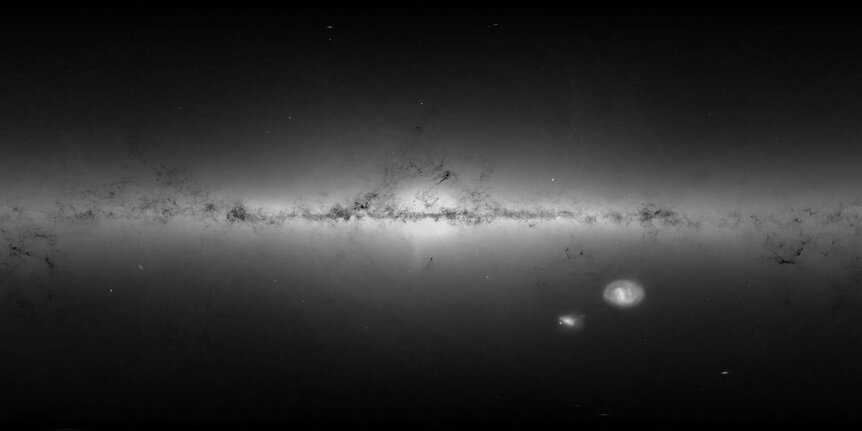
In the density map, you can see a straight line descending down from the galactic center: That's made up of stars from the Sagittarius Dwarf Galaxy, which is being torn apart by the Milky Way's gravity. It's not visible in the color image because the stars are faint, and the color image favors brighter stars. This is exactly the sort of thing that studying the Gaia data will show.
Nearby stars tend to be brighter and their motion larger, so the data for them are better. This animation gives a tour of the more than 300,000 stars within 100 parsecs of the Sun:
The focus on the two clusters is important. The common motion of the stars in the cluster can be used to find their distance (called the moving cluster method), and is one of the many rungs in what we call the distance ladder, where we can measure the distances to nearby stars directly using parallax, then use those numbers to get better distances to more distant stars in clusters, then use that to look at more distant clusters, etc. Each rung along the way gets us farther and farther out, eventually letting us literally measure the most distant objects in the Universe. Gaia is critical for refining the distances to nearby objects, which in turn helps us measure the entire Universe.
So yes, this new data release is A Big Deal.
It also produces a pretty wild number: The acceleration of the solar system by the gravity of the galaxy. Acceleration is by definition the change in an object's velocity, and velocity is a combination of both speed and direction. Calculated as a vector (the centripetal acceleration), the solar system's acceleration should point to the center of the Milky Way, since the center of mass of the galaxy is there.
[Click through to see the thread by Gaia astrophysicist Paul McMillan.]
How do you measure this? Well, there's a phenomenon called the aberration of light. If you are moving, then the light from objects appears to come from slightly ahead of where they'd be if you weren't in motion. This is the same thing as rain appearing to come from ahead of you when you drive through it. So it seems weird, but you're probably already used to this effect.
Gaia measured the very precise positions of well over a million quasars, extremely distant galaxies. They don't move at all on their own as seen from Earth — they're too far away to see any motion they might have — but the aberration of light is easily measured using them. This aberration changes as the solar system moves around the galaxy by a very small amount... but Gaia detected it! It amounts to 0.2 nanometers per second per second.
That's phenomenally small. It amounts to about 7 kilometers per second over a million years, a very small acceleration. The Earth's gravity accelerates you at 10 meters per second per second (in other words, you move 10 meters per second faster every second that you fall), so the force on you by our planet is 50 billion times what you feel from the entire galaxy!
Also, the acceleration measured does indeed point to the center of the galaxy. Not exactly, because the Large Magellanic cloud tugs on us too, and there are other effects, but it's pretty much right where it was expected to be, showing just how precisely Gaia is working.
There's much more here, too, but I think you get the idea. I'll be writing more about this in the months to come, no doubt, as astronomers dig into the catalog to see how it affects their own projects. This catalog has hundreds of millions of new sources and measurements, and there are bound to be tons more things discovered in it.
It's a big galaxy. Oh, and that reminds me: Despite this database having nearly 2 billion stars in it, the galaxy as a whole has more than 100 billion, so this represents only 2% of the Milky Way.
It's a very big galaxy.